Vital signs in real-time

AVAILABLE NOW ON GITHUB

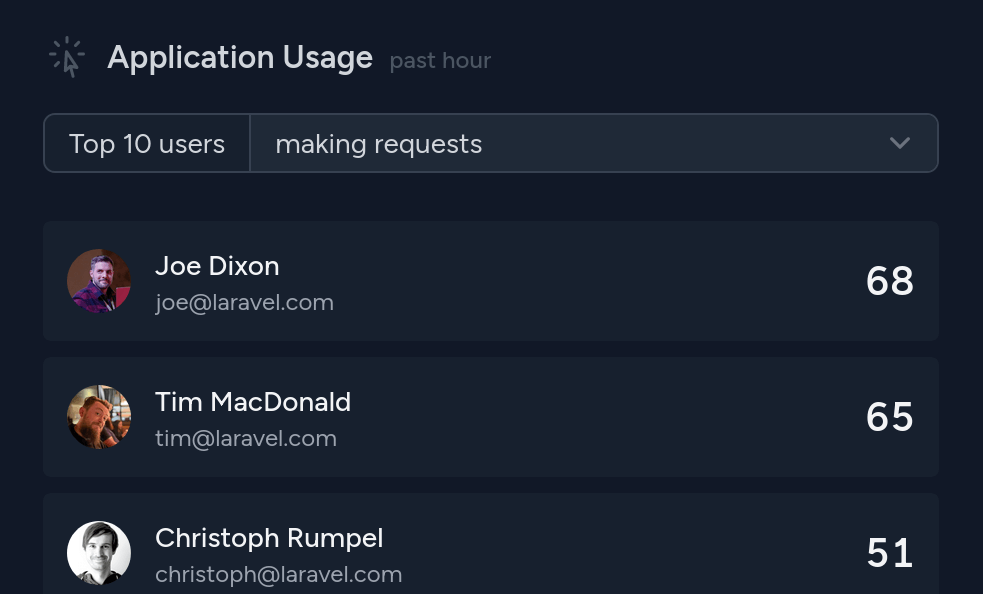
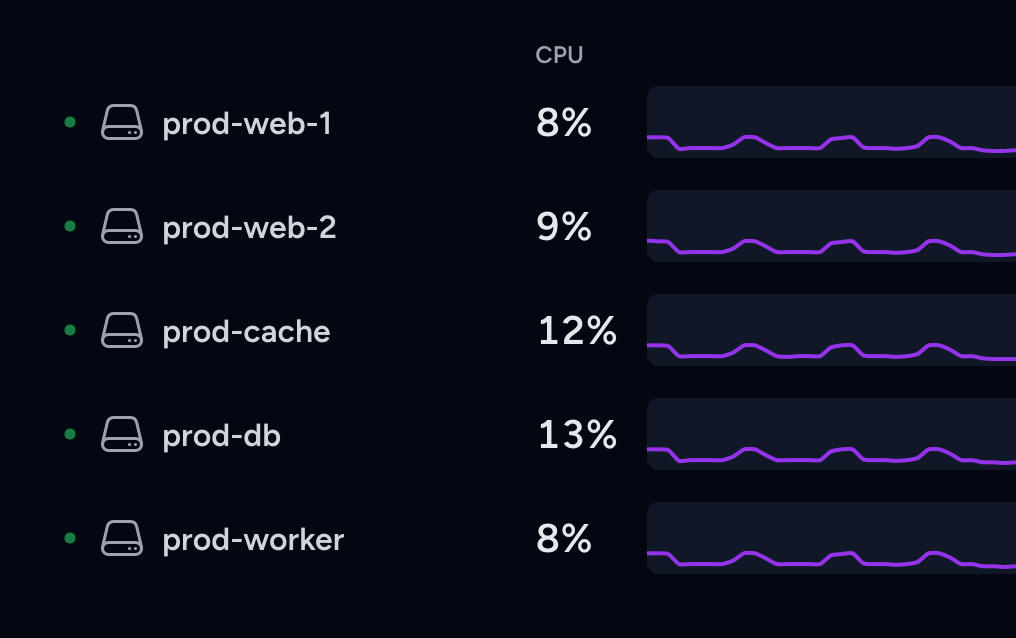
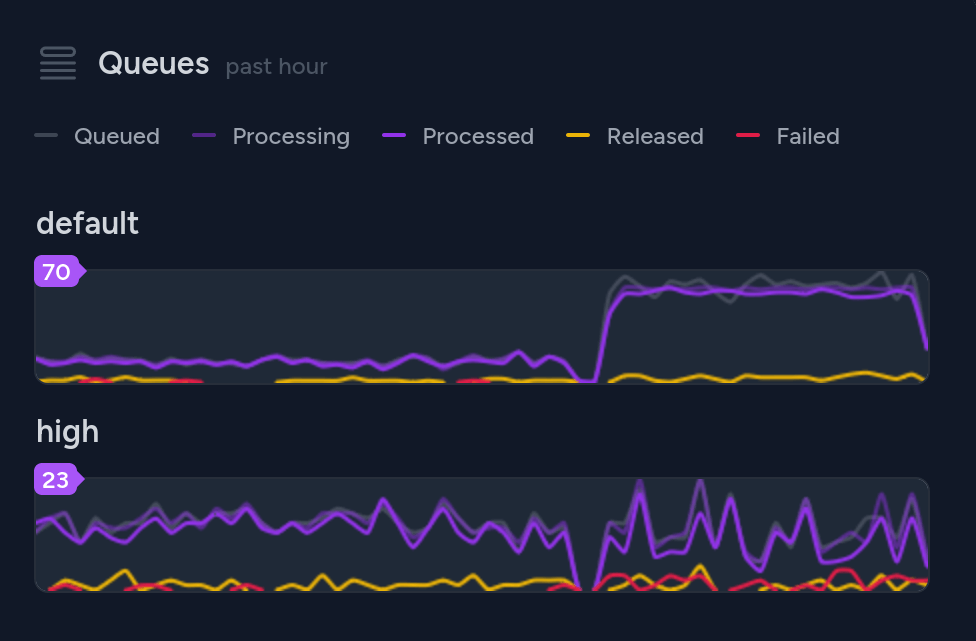
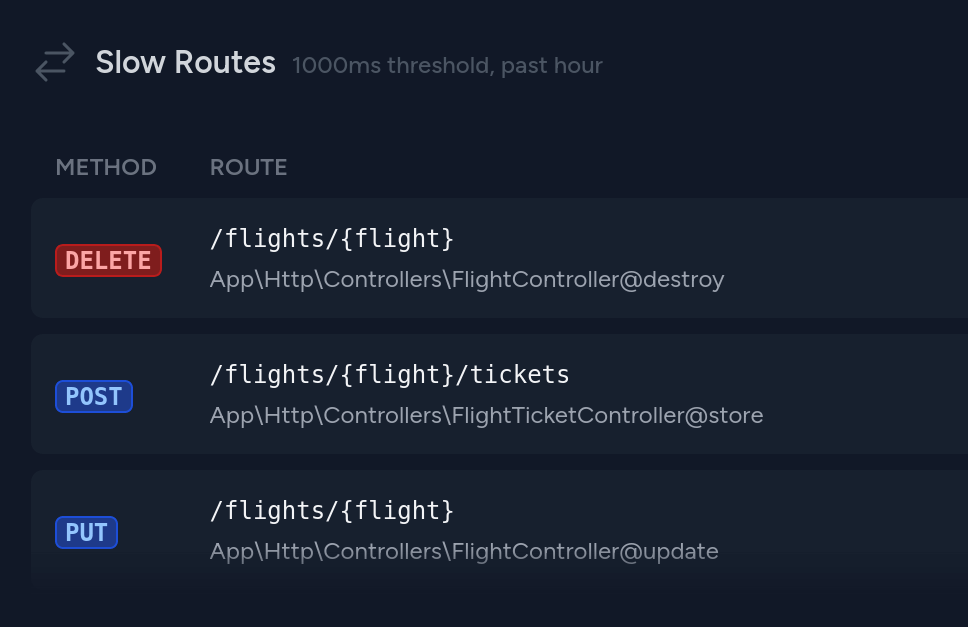
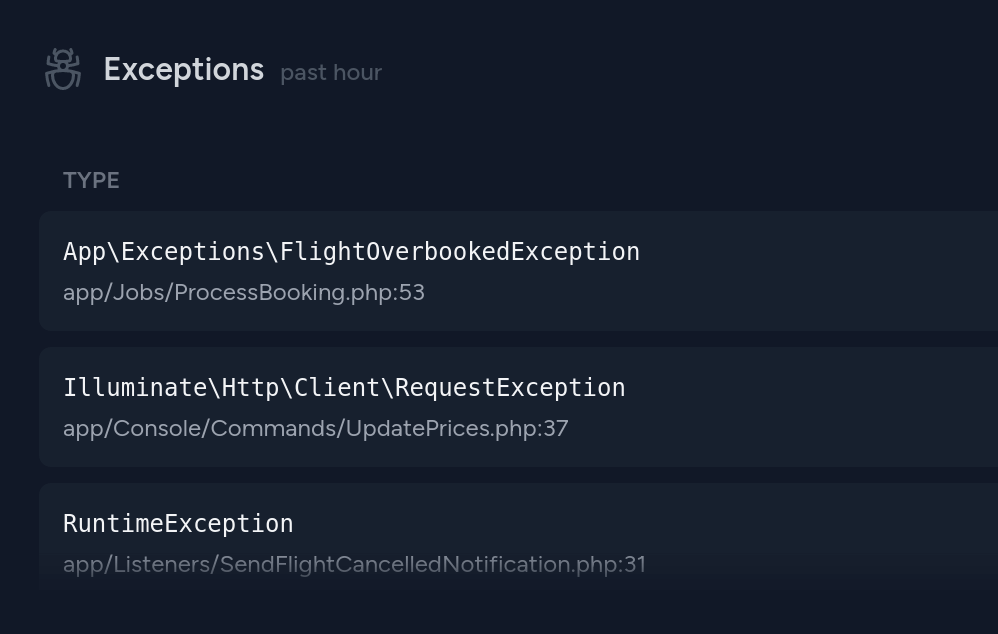
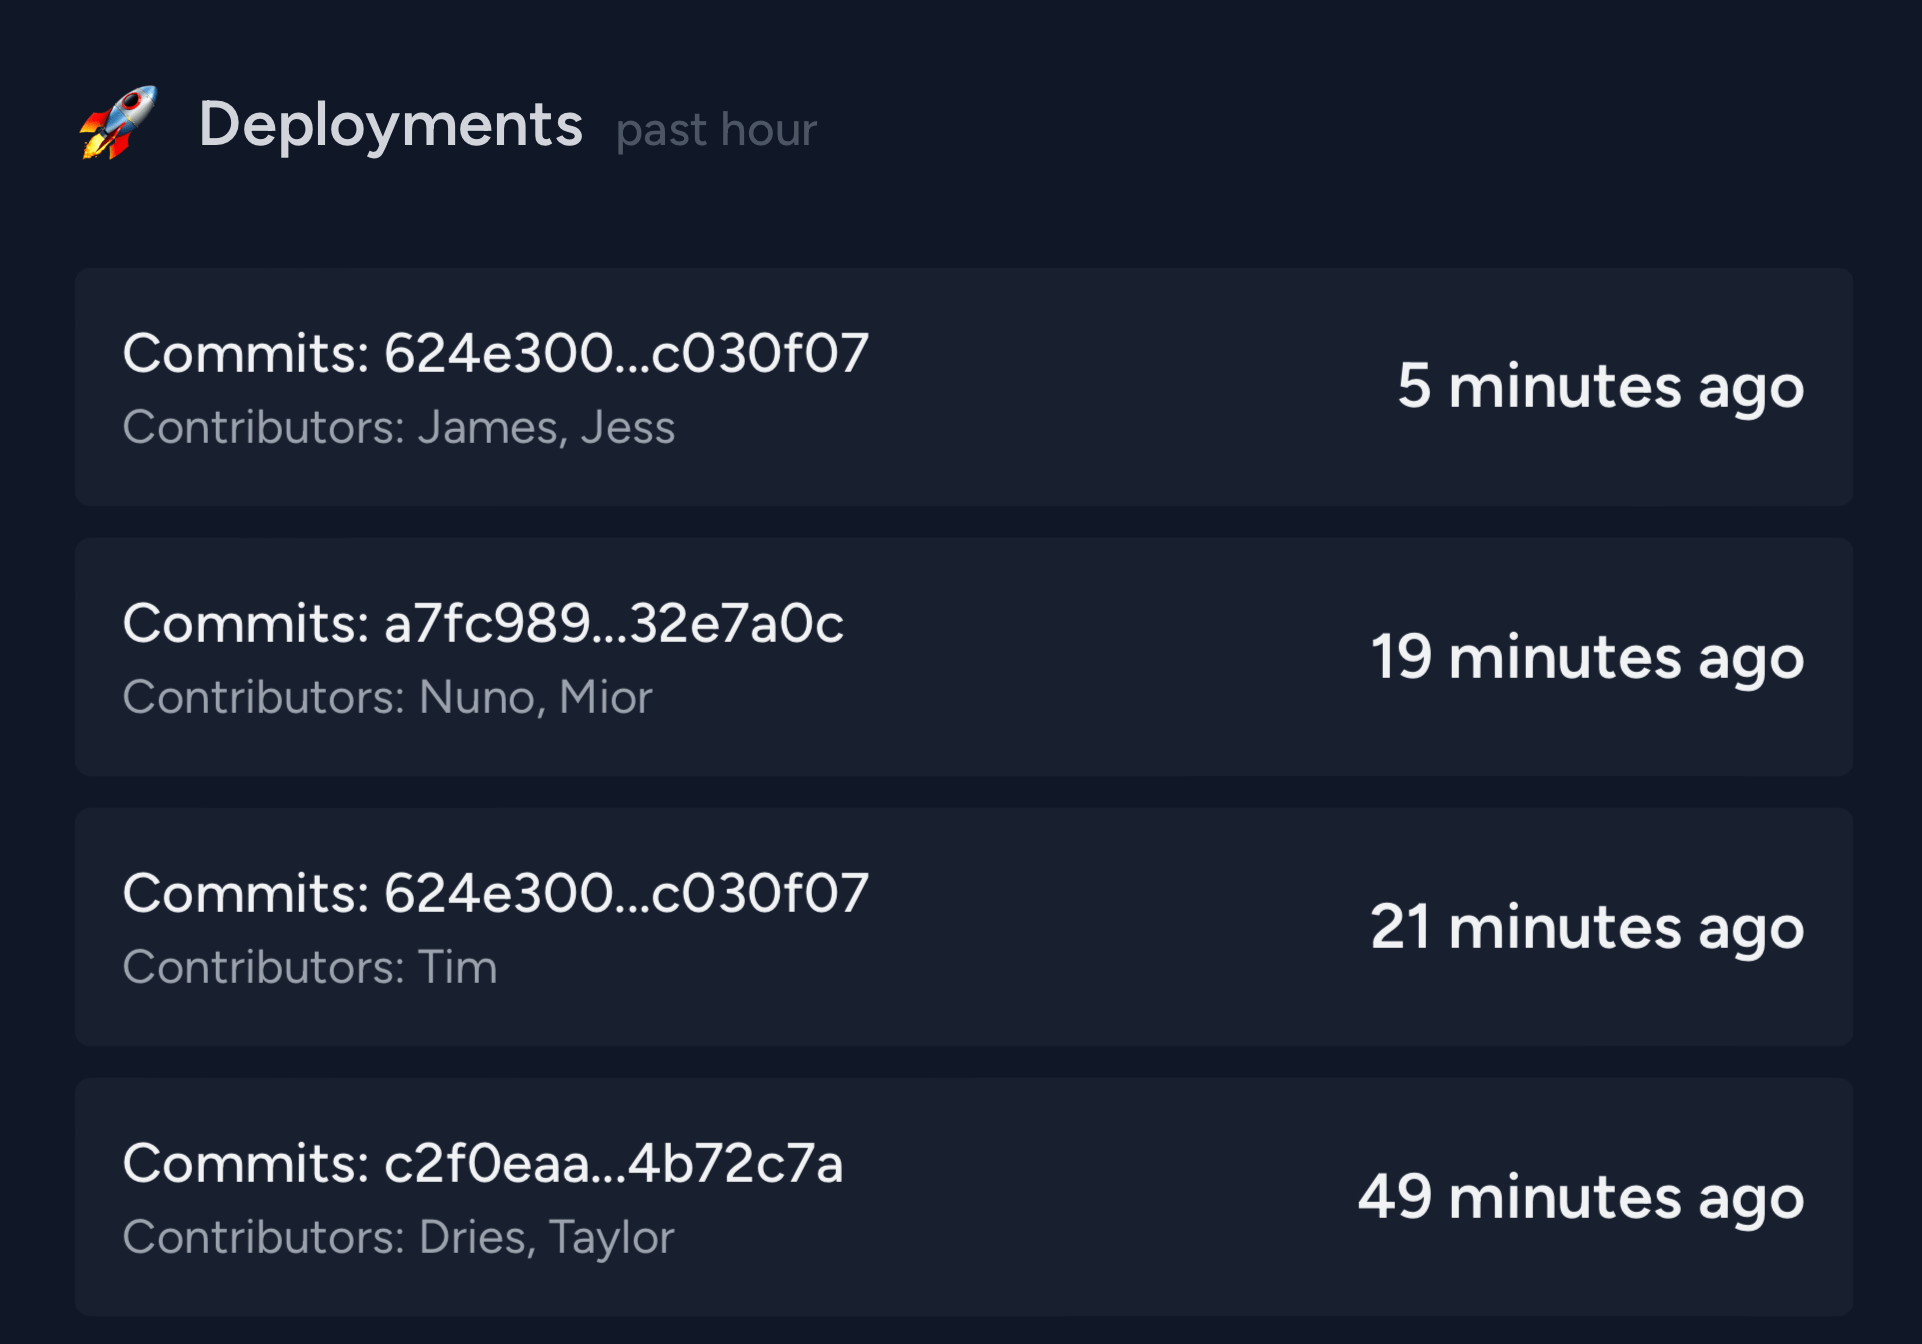
Pulse delivers at-a-glance insights into your application's performance and usage. Track down bottlenecks like slow jobs and endpoints, find your most active users, and more.

See The Features Read The Docs

Free, open source, and ready for extension.

Application Usage

Uncover the users who make the most requests, engage with the slowest endpoints, and dispatch the most jobs throughout your Laravel applications.

Server Stats

Monitor your server's CPU, memory, and disk usage. Running multiple servers? No sweat. Pulse can monitor all your servers in the one place.

Queue Monitoring

Take the guesswork out of optimizing your queue workers. See real-time and historical stats for how many jobs are pending, how many failed, and how many processed successfully.

Performance

See a high-level overview of your applications performance bottlenecks. View the slowest endpoints, queries, jobs, and outgoing requests that are impacting users.

Trending Exceptions

Get an overview of the exceptions happening in your application. Having your exceptions side-by-side with your application's complete health overview helps you find anomalies across your whole stack.

Bring Your Own

Craft custom cards for yourself or create shareable cards for the Laravel community. You can even customize the layout of the Pulse dashboard.